Context Summary
In the era of big data, augmented capabilities are becoming key differentiators for analytics and business intelligence (BI), data science, and machine learning platforms. Tools that leverage machine learning (ML) and artificial intelligence (AI) are transforming how analytics are developed, consumed, and shared.
With an emphasis on self-service and augmentation, these modern analytics and business intelligence platforms support a complete workflow, from data preparation to visual exploration and insight generation.
Augmented analytics, a high-growth force in business
What is Augmented Analytics?
As a technology that automates the selection and preparation of data, augmented analytics includes embedding AI, machine learning, and natural language processing (NLP), into traditional analytics. It allows faster access to insights derived from massive amounts of structured and unstructured data to uncover hidden insights, remove or predict human bias.
A Growing Market
According to analyst firm Research and Markets, the global augmented analytics market will grow from $4.8 billion in 2018 to $18.4 billion by 2023, at a compound annual growth rate (CAGR) of an impressive 30.6%. The growth of augmented analytics will be highest in the banking, financial services, and insurance markets.
In the latest Magic Quadrant report, Gartner, Inc. predicts that by 2023, 40% of machine learning model development and scoring will be done with products that do not have machine learning as their primary goal; data stories will be the most widespread way of consuming analytics, and 75% of stories will be automatically generated using augmented analytics techniques by 2025.
Magic Quadrant for Analytics and Business Intelligence Platforms
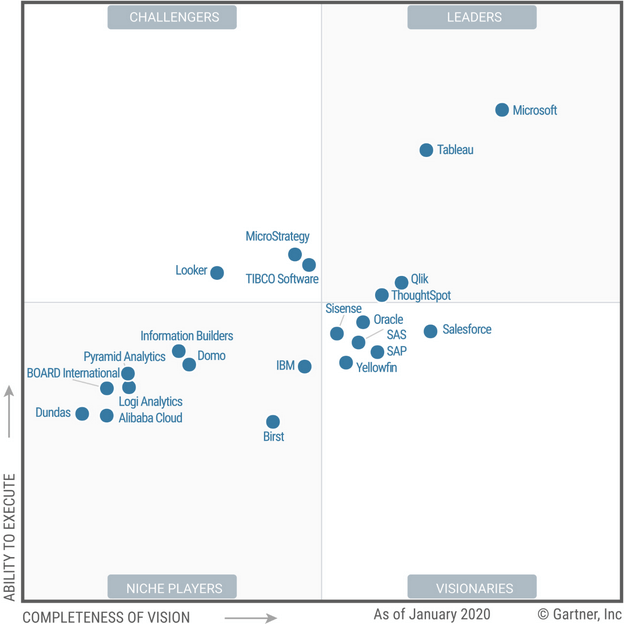
According to Gartner’s market share analysis (Market Share Analysis: Analytics and BI Software, Worldwide, 2018), the number of people using business intelligence platforms is accelerating massively. Microsoft, for example, has millions of users around the world using its Power BI cloud service.
Through its comprehensive and visionary product roadmap: data preparation, visual-based data discovery, interactive dashboards and augmented analytics in Power BI, Microsoft has been an analytics and BI leader for the past 12 consecutive years, as illustrated in the above Gartner’s Magic Quadrant.
Migrating from traditional reports to advanced platforms such as Microsoft Power BI, Tableau, Qlik, and many others will not only provide you with interactive data visualization but will also paint a comprehensive overview of your data.
Encora’s Data-as-a-Service Model
To meet the demand for acceleration, we have defined an analytics model consisting of plug-and-play dashboards, built-in Microsoft PowerBI, and ready to be placed on top of a standard data lake delivered on the cloud with Microsoft Azure. This accelerator can be delivered through a subscription under the Data-as-a-Service model.
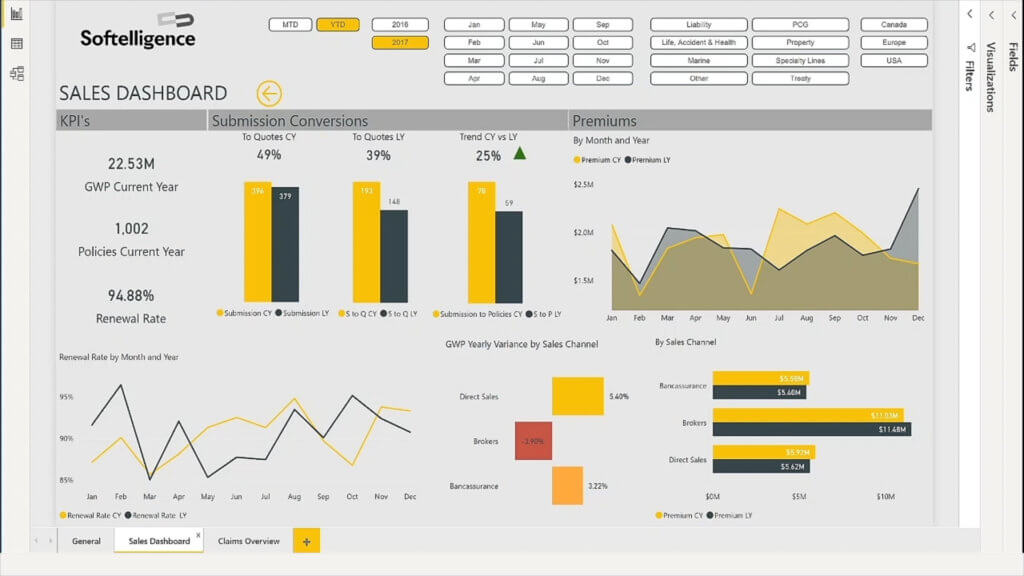
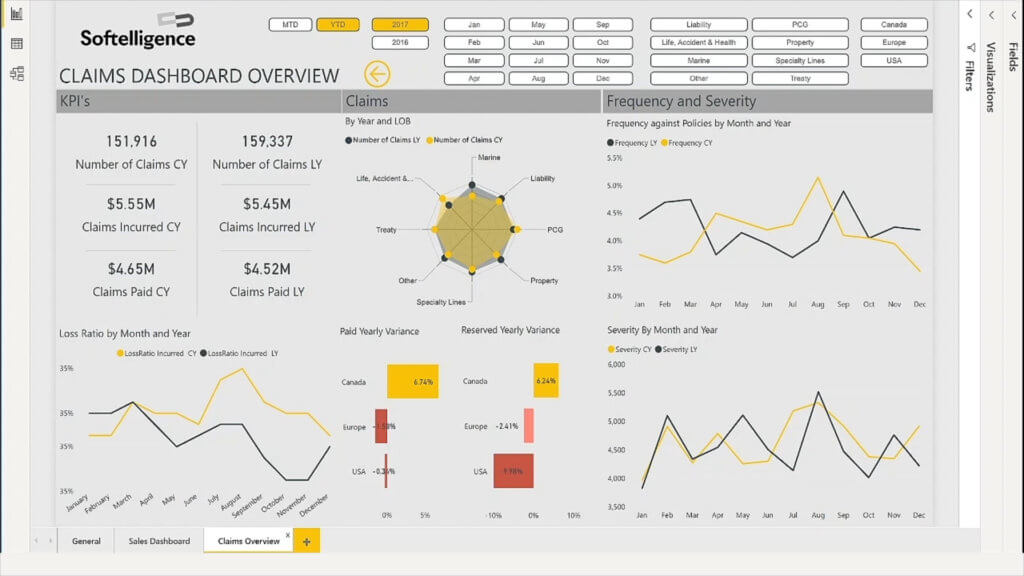
Let’s take for example this showcase tailored to the demands of Insurance carriers.
Here you can track vital KPIs in a convenient visual dashboard designed to facilitate insight through data and accelerate data-driven decision-making for executives, business leaders and beyond: Loss Ratio data, Retention rates, Benchmark Gross Written Premium statistics and breakdown by the line of business and yearly variances, Total Exposure as well as metrics related to Policies and Claims.
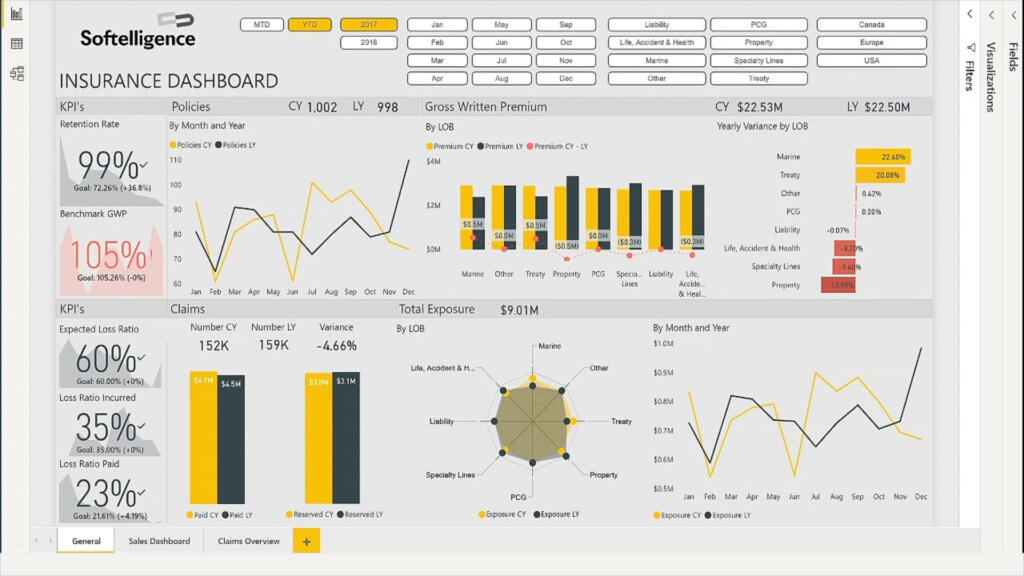
Furthermore, you can easily drill down into any information available on the dashboard. Additional Sales and Claims Dashboards cater to the business intelligence needs of these specific functions.
Conclusion
If you infuse automation, machine learning, and AI capabilities within your analytics services, the result will be visibly faster time to insights from your data, which means faster time to decisions and the ability to become a truly data-driven business.
If you are looking for a strategic partner who can help you create custom visualizations, automate reporting, and enable your end-users, learn more about our Data and Analytics solutions.
Resources:
2020 Gartner Magic Quadrant for Analytics and Business Intelligence Platforms
Analyst firm Research and Markets
Market Share Analysis: Analytics and BI Software, Worldwide, 2018